How low (latency) can you go with Flink?
A large institutional client recently asked us todemonstrate Flink’s capability to perform stateful computations on large streams of data within 20 milliseconds (0.02 seconds ). In prior tests, we have consistently achieved 40-70ms for computations, but those were executed a while ago, and with different scenarios than the use case outlined here.
Low latency can mean different things in different situations. Prior to embarking on the test, we had to discuss clear success criteria with the organization. In this case, it was a simple conversation, as they had clear SLAs to meet. They wished to assure themselves that Flink would match or exceed the existing performance of a time-series database that required a lot of maintenance and could not support further volume increases.
We agreed on several parameters which are described in the slide below:
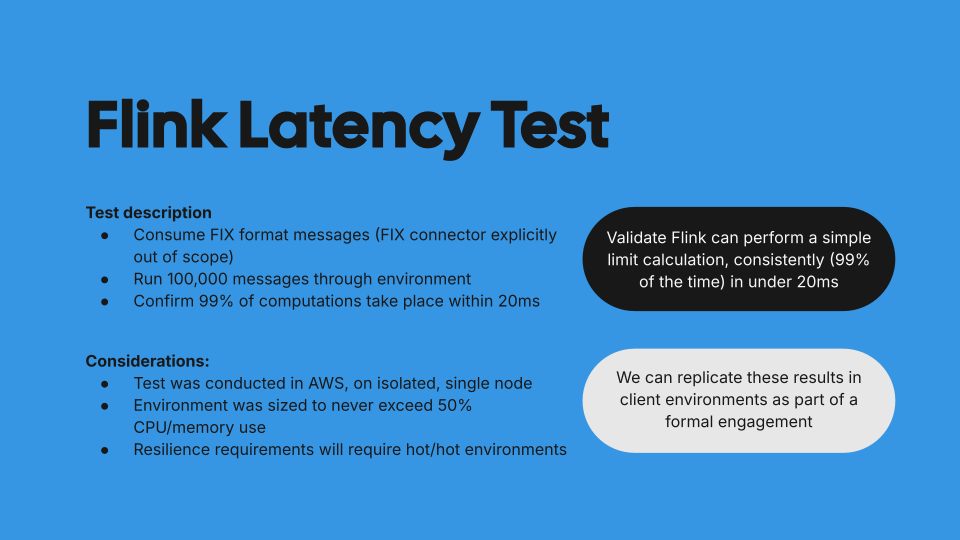
It is worth noting that we provisioned larger instances than strictly necessary for the environment since any back-pressure would breach the desired SLAs.
The use case is a limits monitor which aggregates incoming trade orders by account and symbol. When limits are breached a particular event should be emitted. For the purposes of the demo, we emit an event for every incoming order. In a real-world example, it is likely that the application would only emit events when the limit is breached. The organization in question had already optimized the ingestion of their order flow and did not wish to measure this. The starting point was an order stream in Kafka.
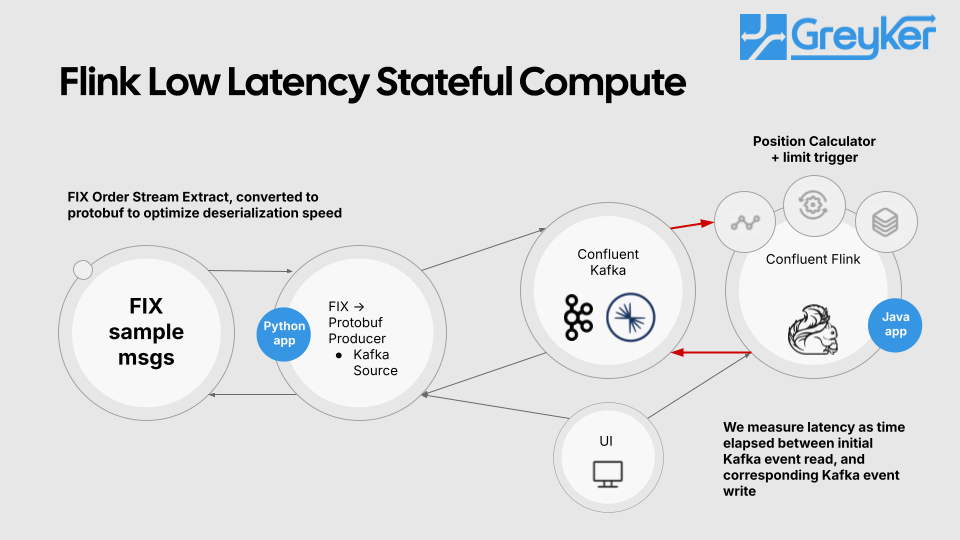
The demo was conducted in a cleanroom environment on a single node in AWS. We sampled a FIX order stream, transformed it into Protobuf events and published them onto Kafka. Once the events were in Kafka, we calculated position by account and symbol and evaluated it against a limit for the acount/symbol pair.
For real-world implementations, we have written dynamic rules engines in Flink to perform more complex evaluations on data. The latency increases a bit, but remains in the same ballpark. Please contact us if you would like to discuss a specific situation
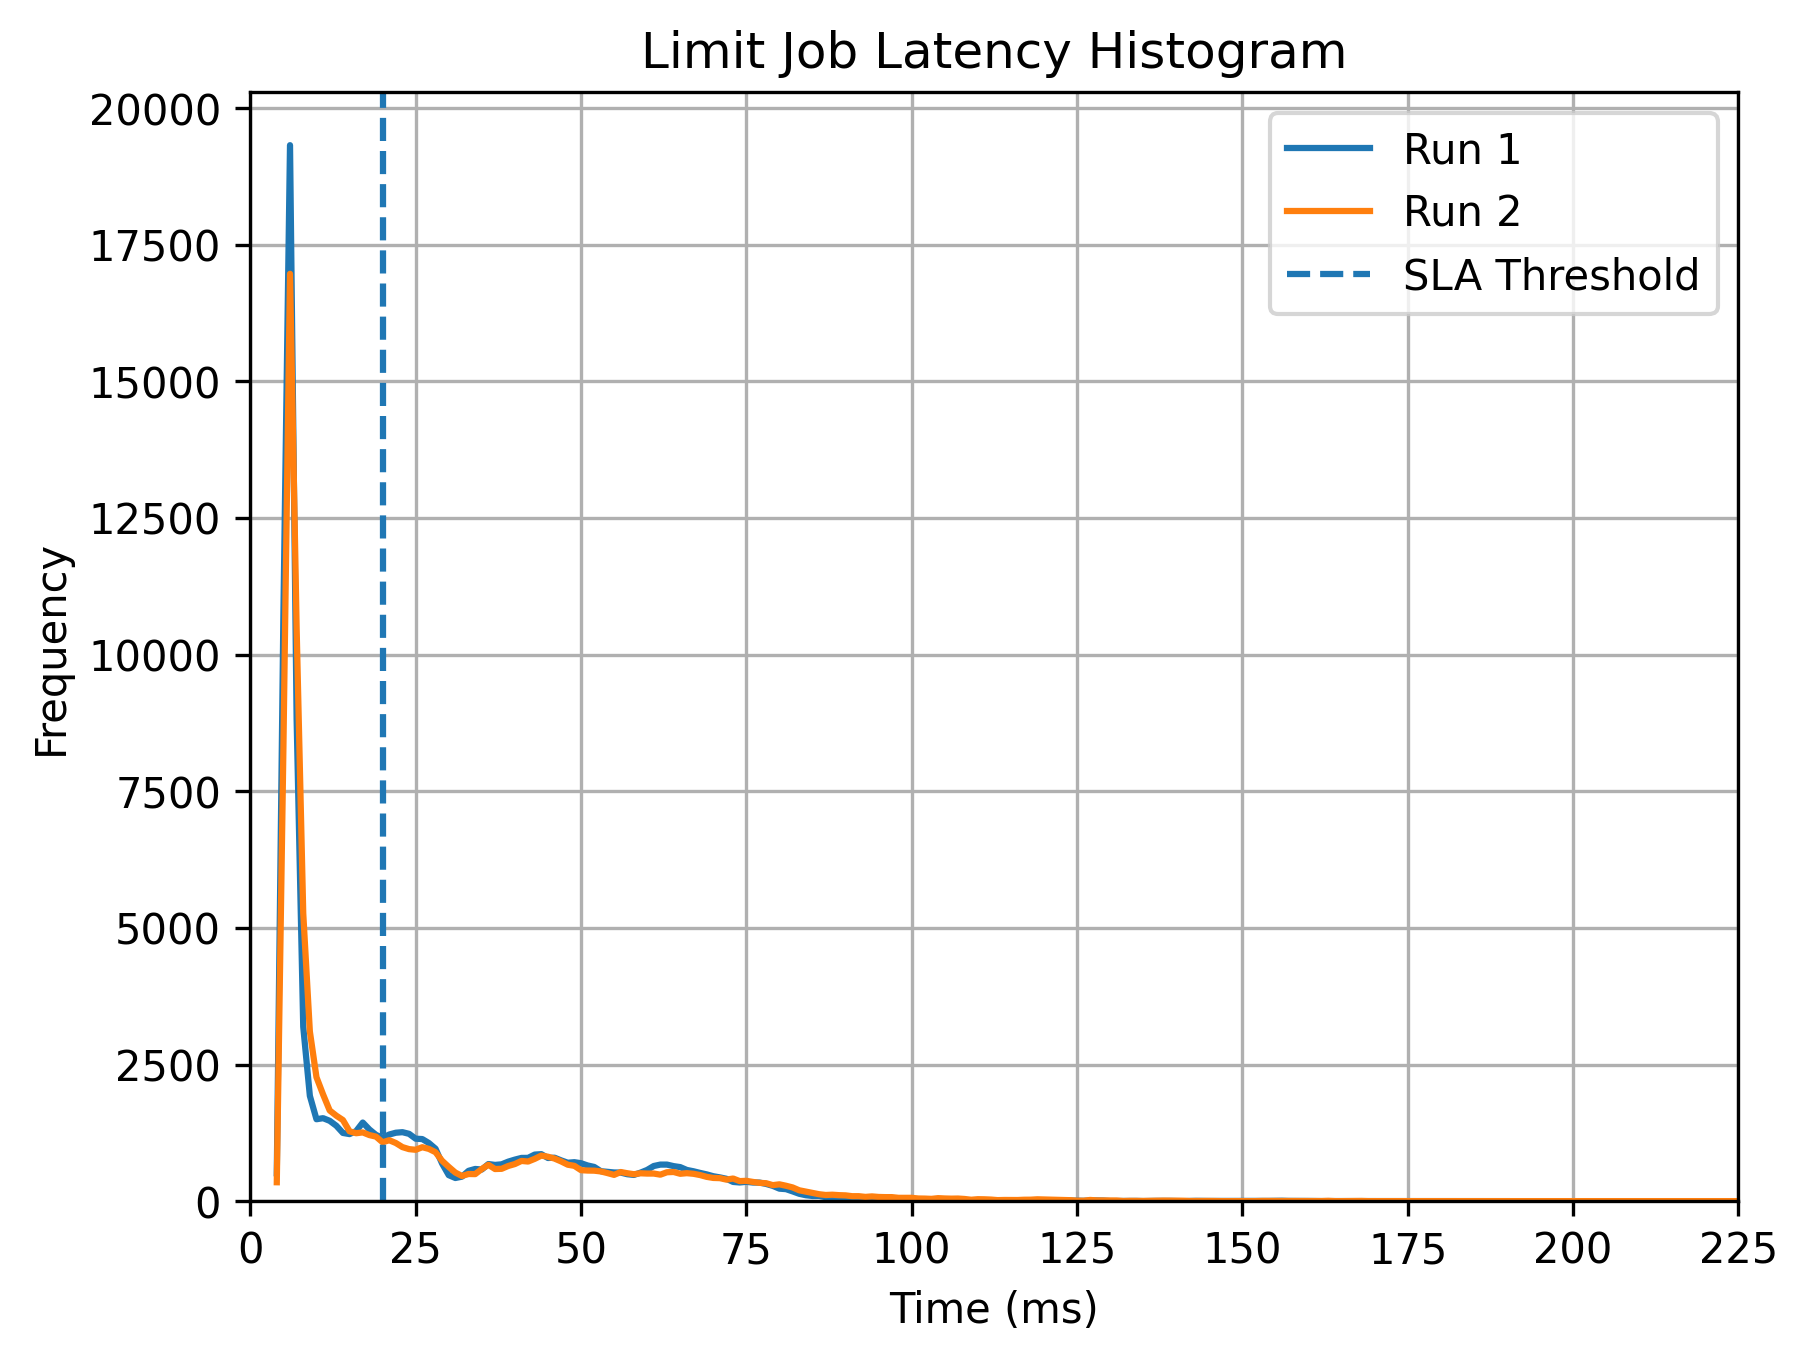
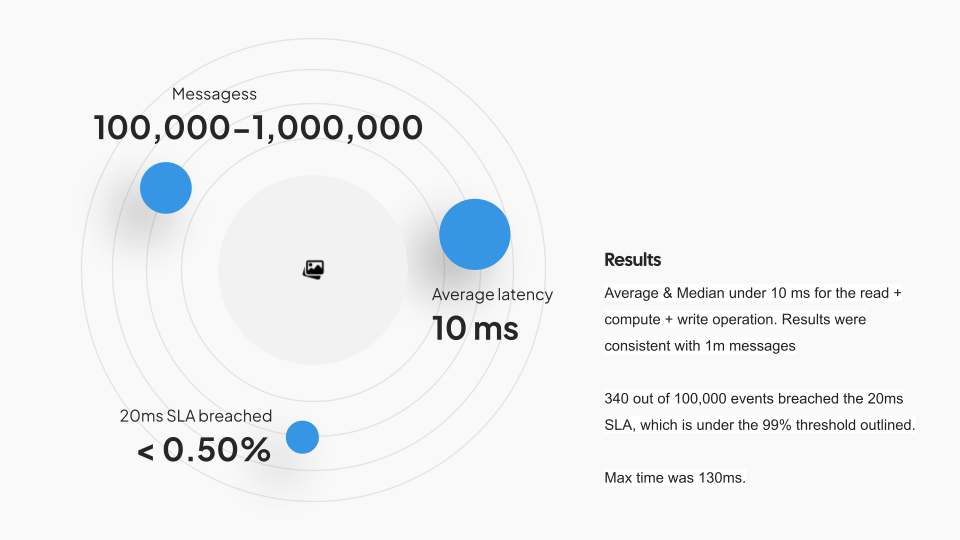
Once we ran over a million messages through the environment, we collected timestamps for order events and matched them to the limit evaluation event produced by our stateful computation. We plotted all the events on a frequency histogram, and we can demonstrate that 99.5% of events are processed in under 20ms, with an average processing time of 10ms.
The results validate the question we were asked to evaluate. Can a stateful computation be run in Flink, at scale, consistently, with latencies under 20ms.
The results are summarized below:
This test was done in a clean room environment and real-world results may vary for several reasons including:
our environment consisted of a single VM. Network latency could impact results
The environment was over-provisioned for the use case. Any back-pressure will breach these SLAs, with events taking 100ms or more to process.
The topics had a single partition to provide strict ordering (as per the client’s requirements) without compromising latency. Partitioned topics and higher degrees of parallelism may result in more variation in results.
The actual calculation was relatively simple, an aggregation, followed by an evaluation against a limit. More complex computational pipelines could well result in longer compute times, as would network shuffles for data pipelines that require delivering data across keyed streams being processed by different task managers.
Despite these caveats, the test is a useful barometer for what can be achieved with Flink on commodity hardware. A seven-minute video of the demo follows: