Tracking EV Fleet Battery Health
As the number of EV batteries deployed in the real world rises, the amount of data created by such devices requiring analysis has as well. At sufficient scale a fleet operator or OEM may be dealing with data from 10s of thousands of batteries, each with multiple cells, reporting data multiple times a minute.
Streaming data from such a large group of devices can be a challenge. However, Kafka offers a robust and well proven design pattern to support collecting and recording such data.
Analyzing such a data stream poses its own challenges. Some of the data are time sensitive and may require alerts to equipment or fleet operators. This is where Flink comes in. Flink’s stream processing engine offers many different mechanisms to perform low-latency analytics on high volume data.
To demonstrate how one could solve this data capture and analysis challenge, we built a proof of concept implementation on the Confluent Cloud platform to ingest data captured from a EV battery fleet and analyses this data in real time.

Logical architecture of EV battery data analytics pipeline
We start with over a million telematics readings from batteries and cells. The dataset is derived from tests conducted for eVTOL (electric Vertical Takeoff and Landing) aircraft, which may be manned or unmanned (drones). Similar analysis can be conducted for other types of electric vehicles, including EV powertrains on automobiles.

Each of these readings is streamed into Kafka as an event over the course of 5 minutes. We use JSON for ease of use and to illustrate the visualization within Confluent Cloud.
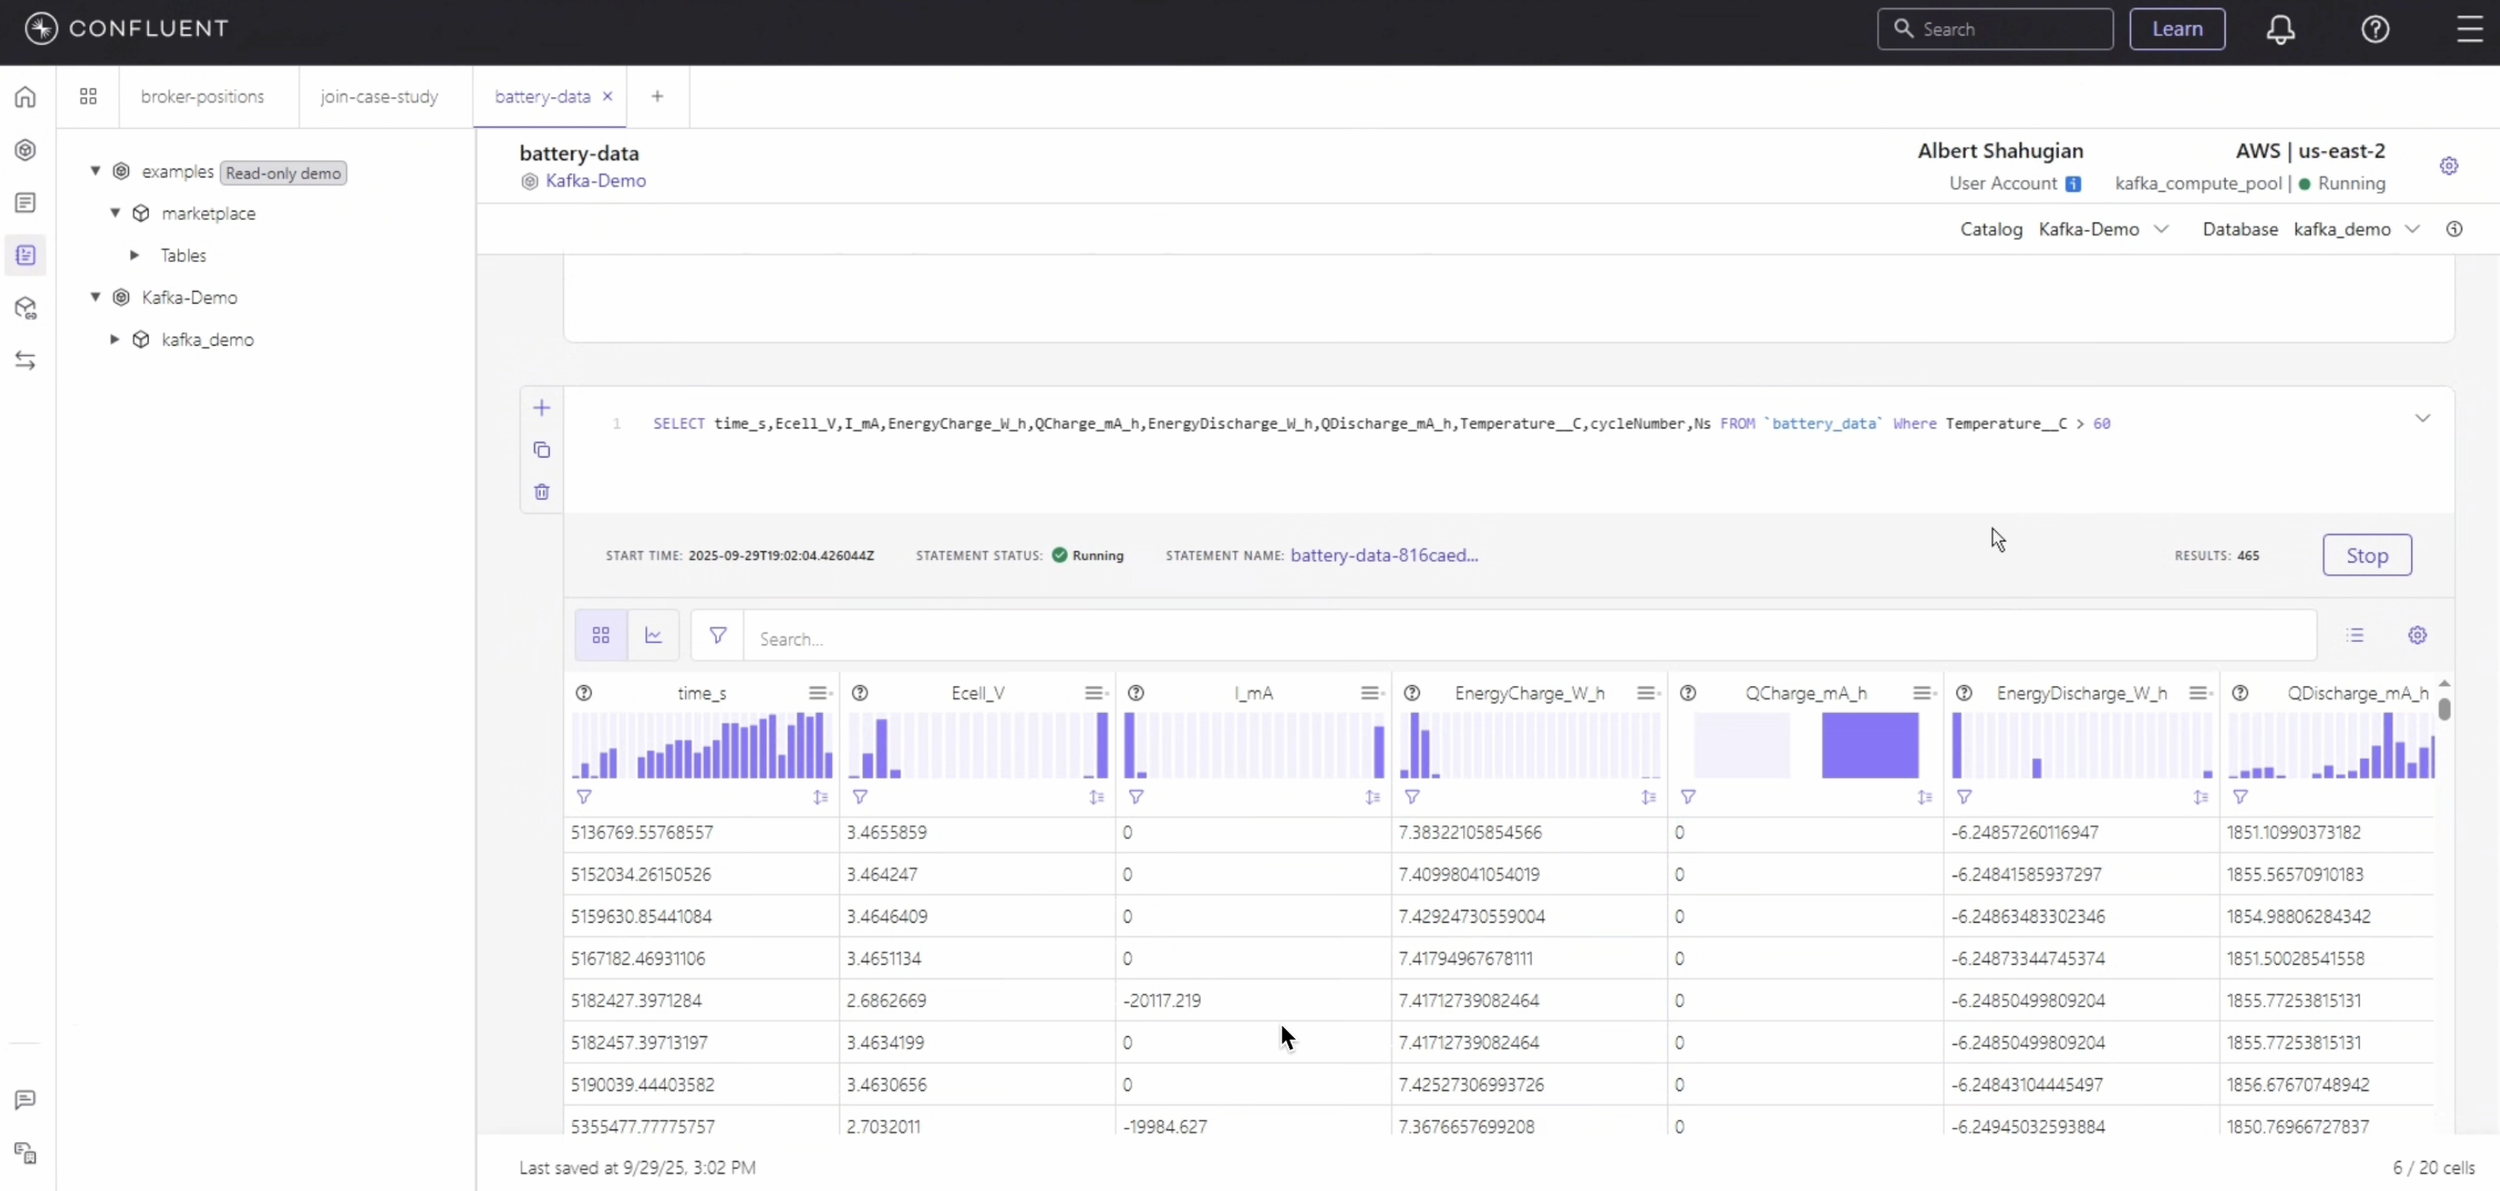
Once the data is streaming in, we can run Flink SQL statements to perform analyses on the data. We have two analyses we wish to run:
A filter to identify battery temperature readings over 60 degrees so they can be republished to a dashboard
A windowed analysis to publish histograms of several different readings which can then be used to perform more complex correlation/causation analysis on this data
Our demo publishes an aggregation that describes the distribution of each metric over the past time minute.
The time window for the analysis can be modified to match requirements. Confluent’s Cloud UI includes a handy visualization of the distribution for each attribute being analyzed. You can also deliver the aggregated results to a visualization tool of your choice.
Once the data are available as a real-time stream, other real-time or batch operations are possible, these may include:
joining the battery data with vehicle geo-location data to analyze the impact of ambient temperature variations
joining the data with vehicle movement analytics to study the impact of motion/stress patterns on battery performance
Contact us at info@greyker.com to learn more or to schedule a live demo. A recorded demo is below…